How it works
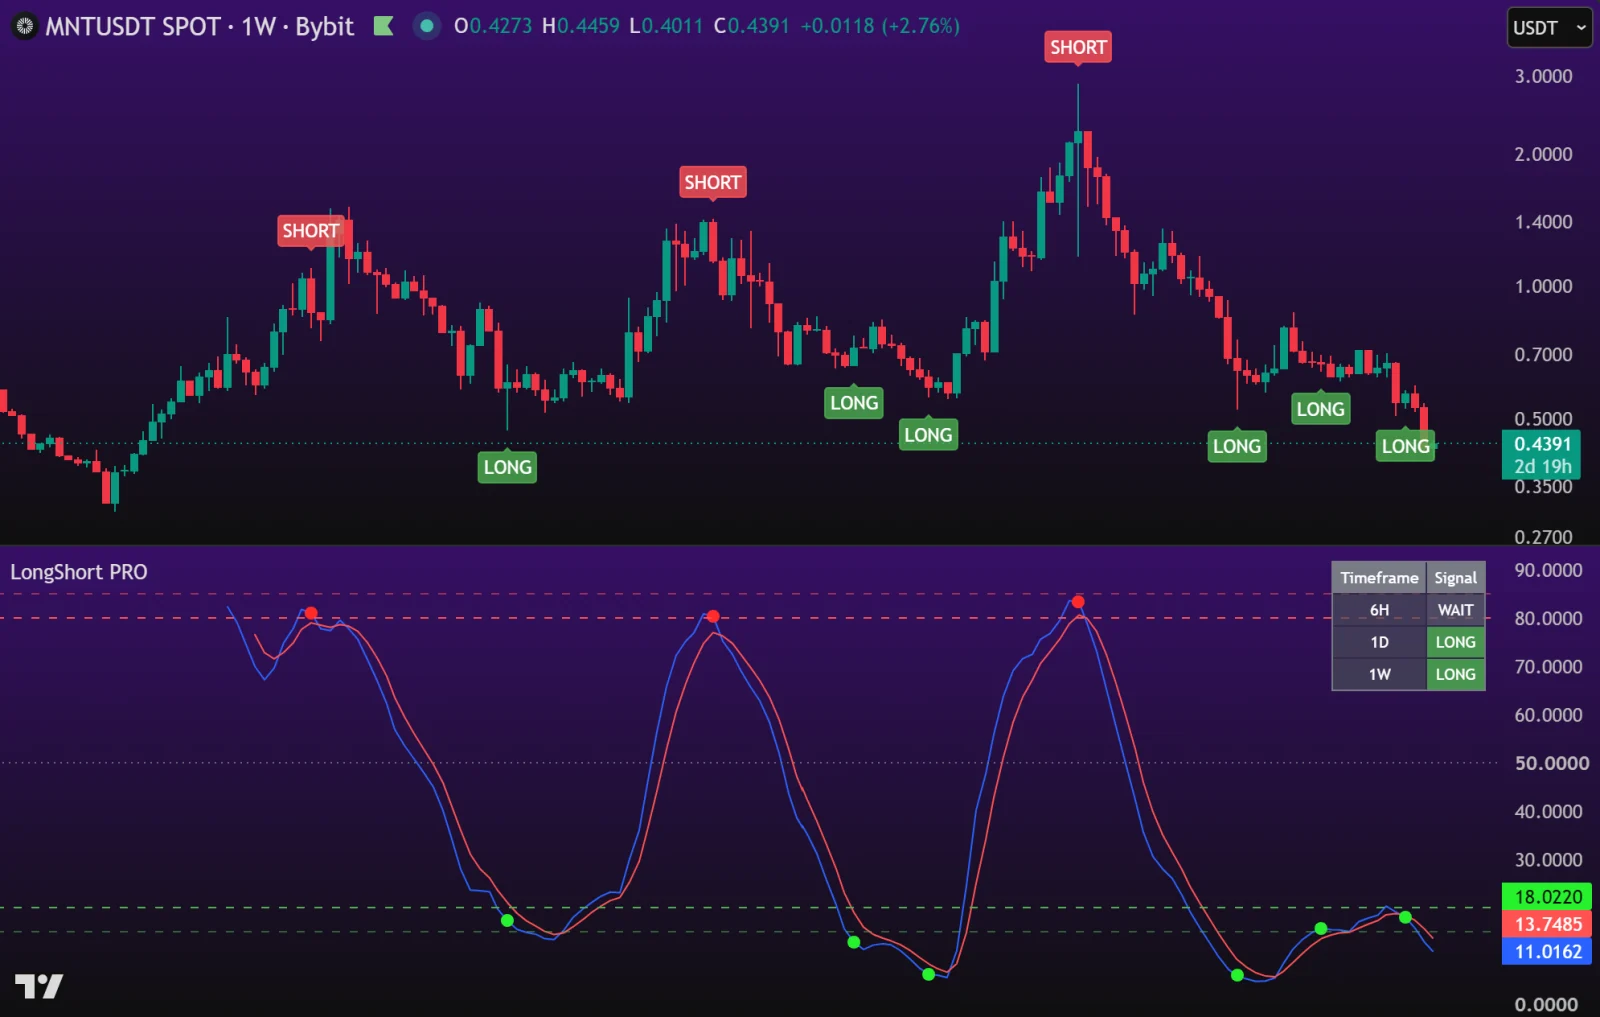
The indicator consists of two curves and limiting zones at the top and bottom.
⬆️ Long ⬆️
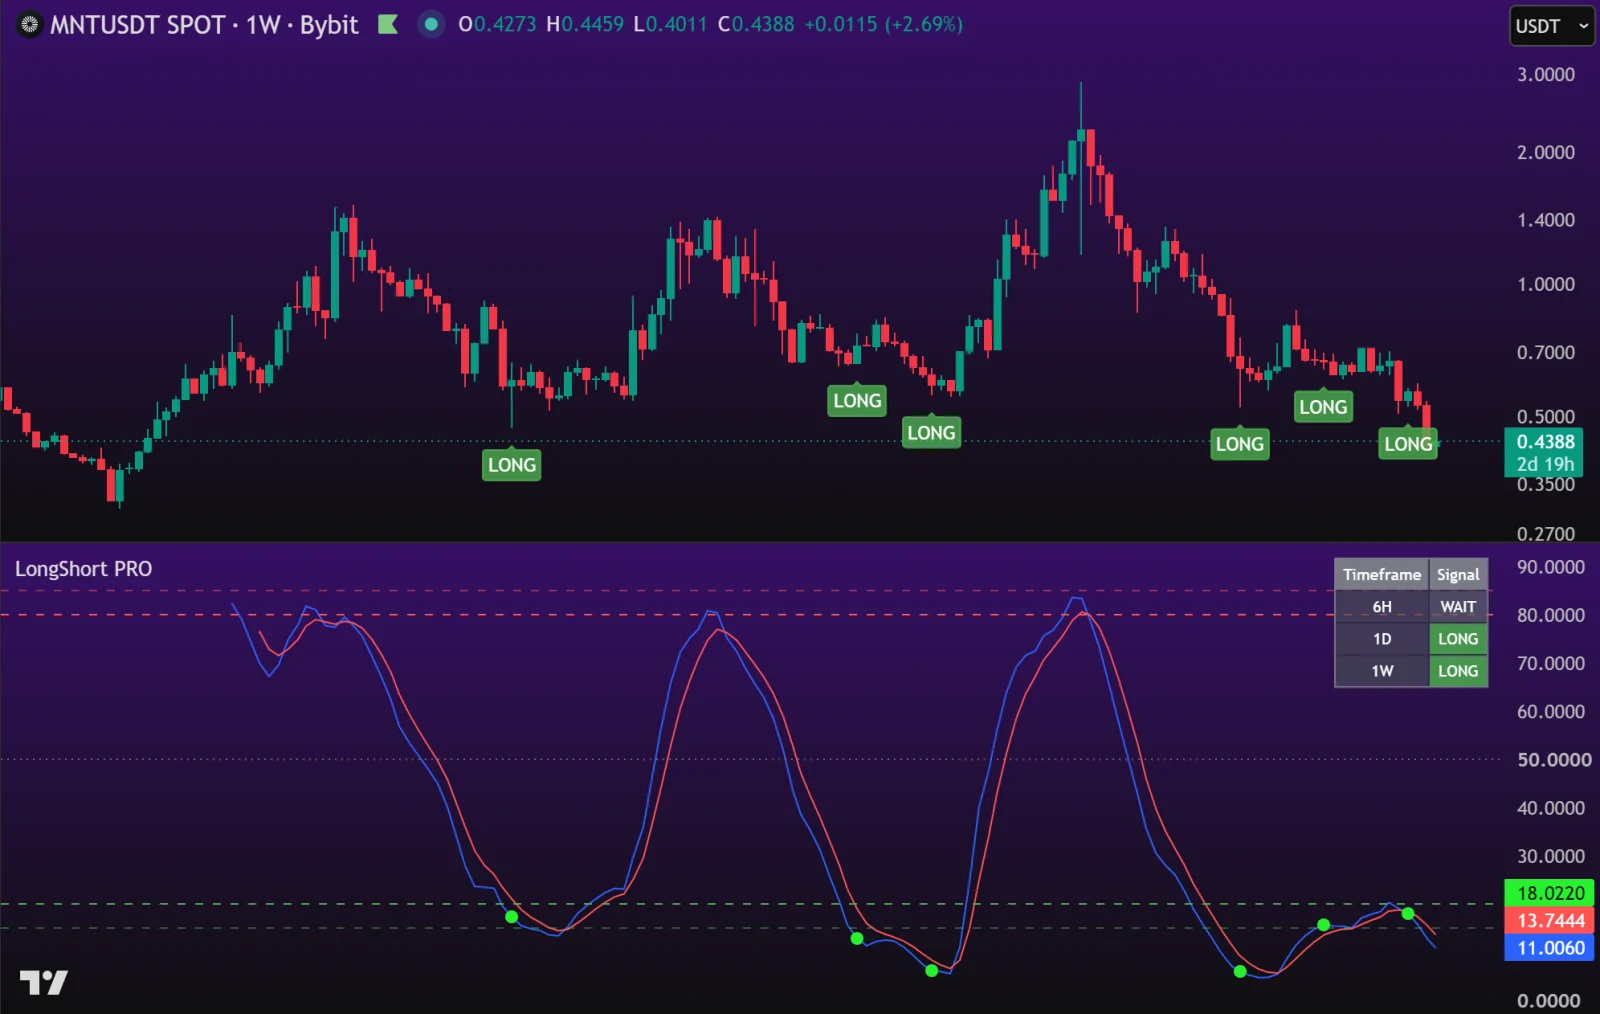
When the two curves are in the lower green zone below 20 – this is a good point to buy the asset.
⬇️ Short ⬇️
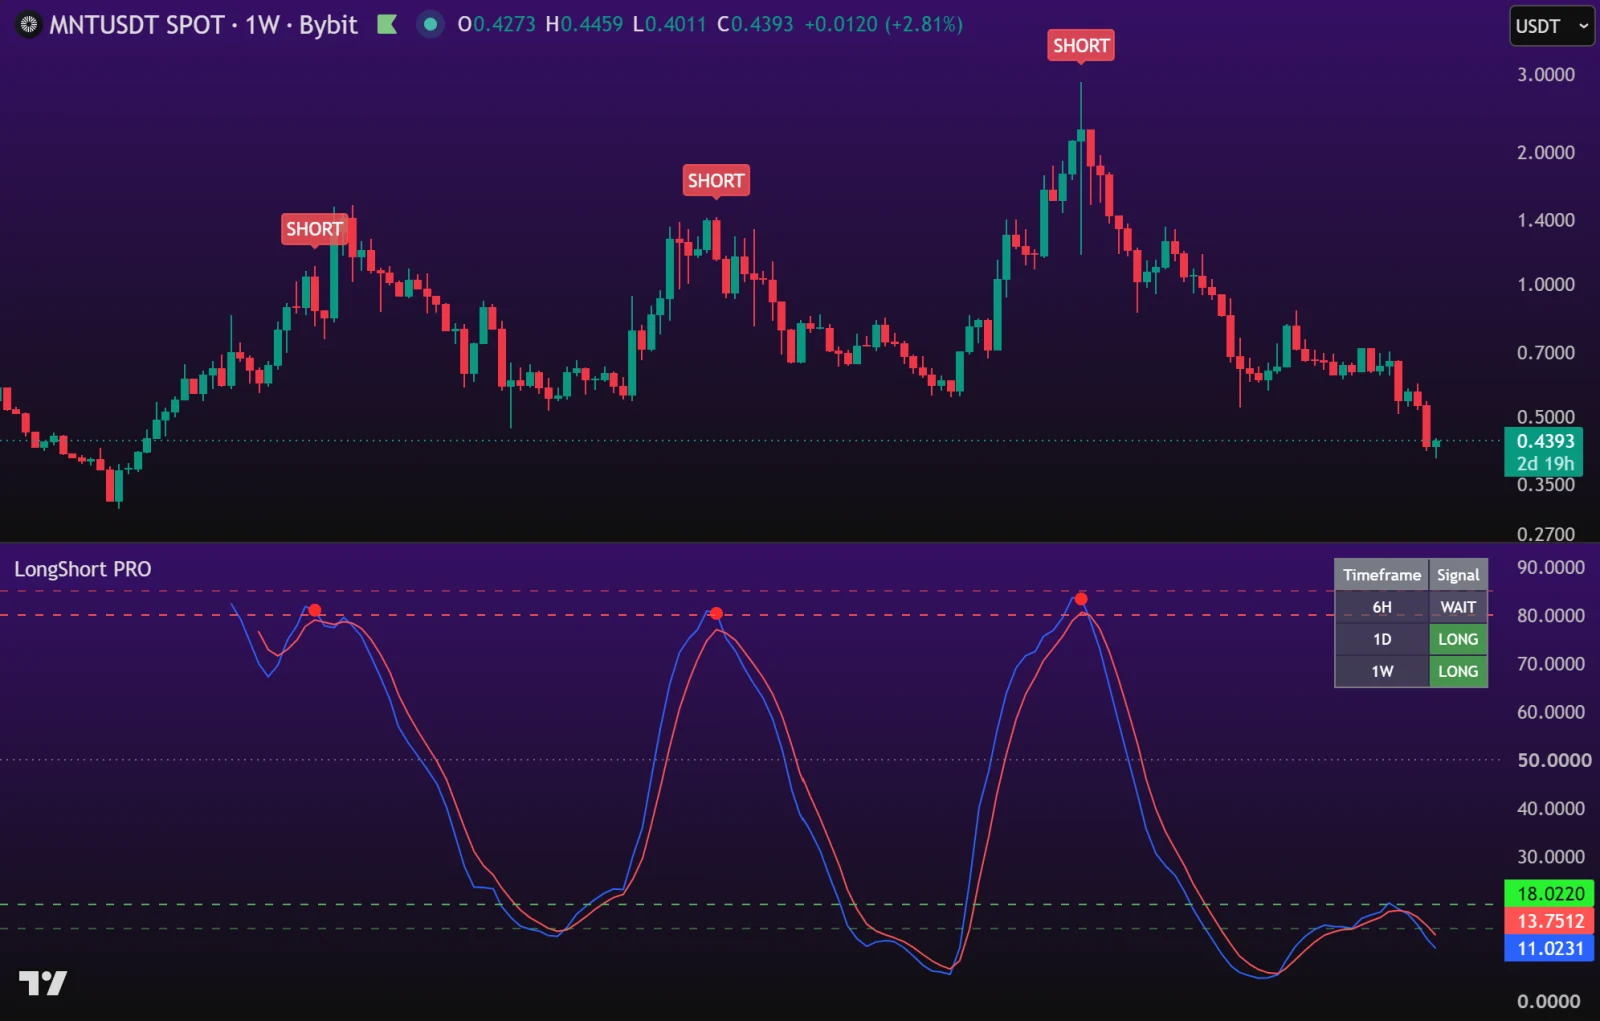
If the curves come into the upper red zone above 80 – you should consider selling the asset.
The LongShort PRO indicator gives the best signals on higher timeframes – the weekly and daily. The lower the timeframe, the higher the probability of noise on the chart and false signals.
A signal on a higher timeframe will be stronger than a signal on a lower timeframe and will more often be a positive trade.
Overbought and oversold#
At the same time, the signal does not guarantee that the asset will grow or fall in price, but indicates that the asset is oversold or overbought. In other words – points where a reversal move in price is technically highly likely.
Overbought – indicates that buyers have already pushed the price up too much and there is little fuel left for further growth
Oversold – indicates that sellers have lowered the asset's price too much and a bounce is statistically likely
Signal confluence across timeframes#
LongShort PRO works on the premise that a signal on a higher timeframe will be stronger than a signal on a lower timeframe and will more often deliver a positive trade result.
Based on the results of the strategy backtesting, we found that if signals coincide across several different timeframes, they have a greater chance of providing a good trade entry. Since the signal is strengthened if it is present simultaneously on several timeframes, analyzing the confluence of such signals only improves the expectation from the signal.
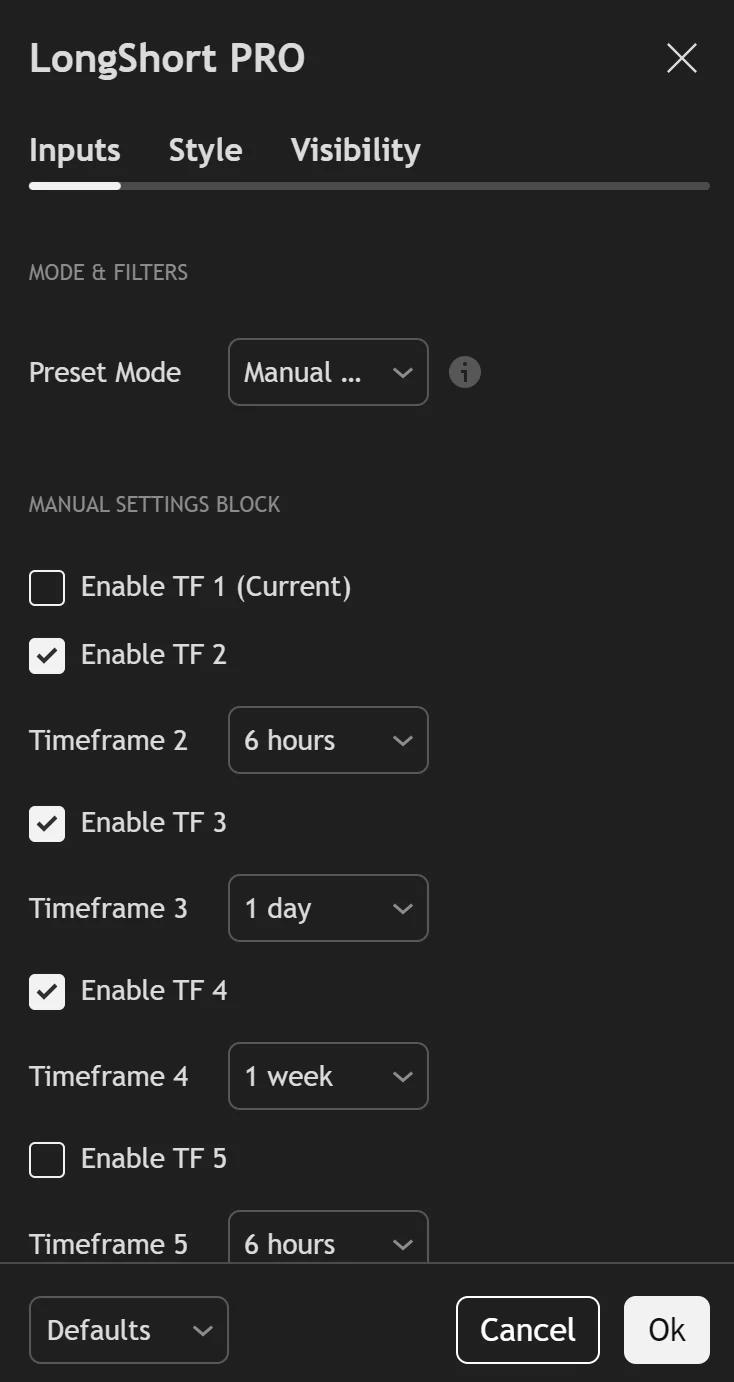
The LongShort PRO indicator is built on a key principle – when signals coincide on all the different timeframes selected in the settings menu, bold red or green dots will appear on the chart, which will notify you of a potential long or short setup for the asset.