First look: GOLD V1 mode
LongShort PRO highlights moments when conditions align across multiple timeframes and shows how the model would have performed in such a trade. Trade decisions and position management remain yours.
Step 1 – select a mode in the Setup dropdown#
| What you want to do | What to select in Setup |
|---|---|
| Use built-in rules for a chosen market | GOLD V1, GOLD V2, Nasdaq 100 E-mini, or BTC+ETH |
| Monitor signals with automatic timeframe selection | Base |
| Choose timeframes, levels, filters, and exits manually | Manual Settings |
Beginners should start with GOLD, so let's jump straight into setup.
Launching the indicator in GOLD V1 mode#
The first launch takes four steps: GOLD chart > indicator > GOLD V1 mode > reviewing signals.
No manual settings are needed for this.
Open the Gold asset in TradingView on a standard candlestick chart and select a timeframe from the supported list: 30s, 1m, 2m, 3m, 5m, 15m, 30m, 45m, 1h, 2h, 3h, 4h.
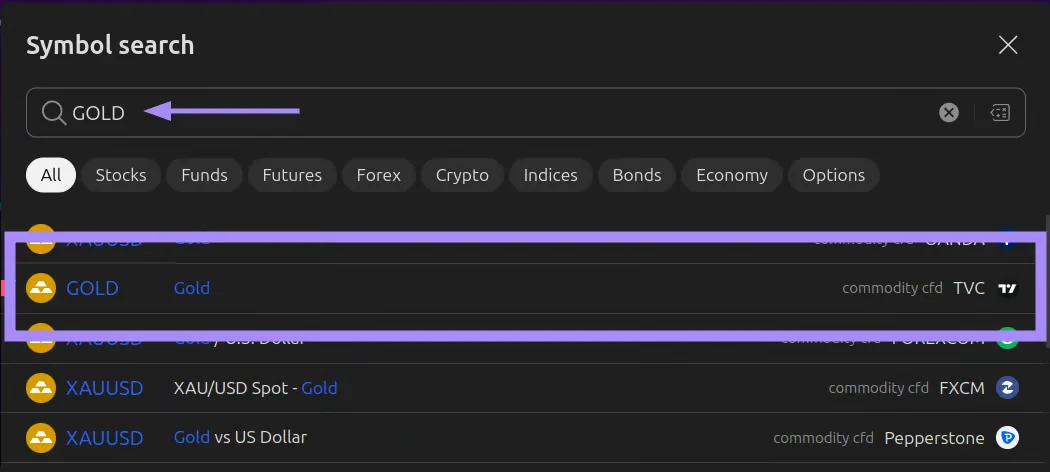
You can run the indicator on any exchange chart: it will adapt to the available data. However, testing was done on specific sources: TVC, MNQ, and Binance spot. The strategies perform most accurately on these, so it's best to choose them.
For GOLD V1 mode, "GOLD cfd TVC" is the preferred choice.
Add the LongShort PRO indicator to the chart and open its settings. In the SETUP section, select GOLD V1. The manual settings fields will be grayed out: they don't affect this mode.
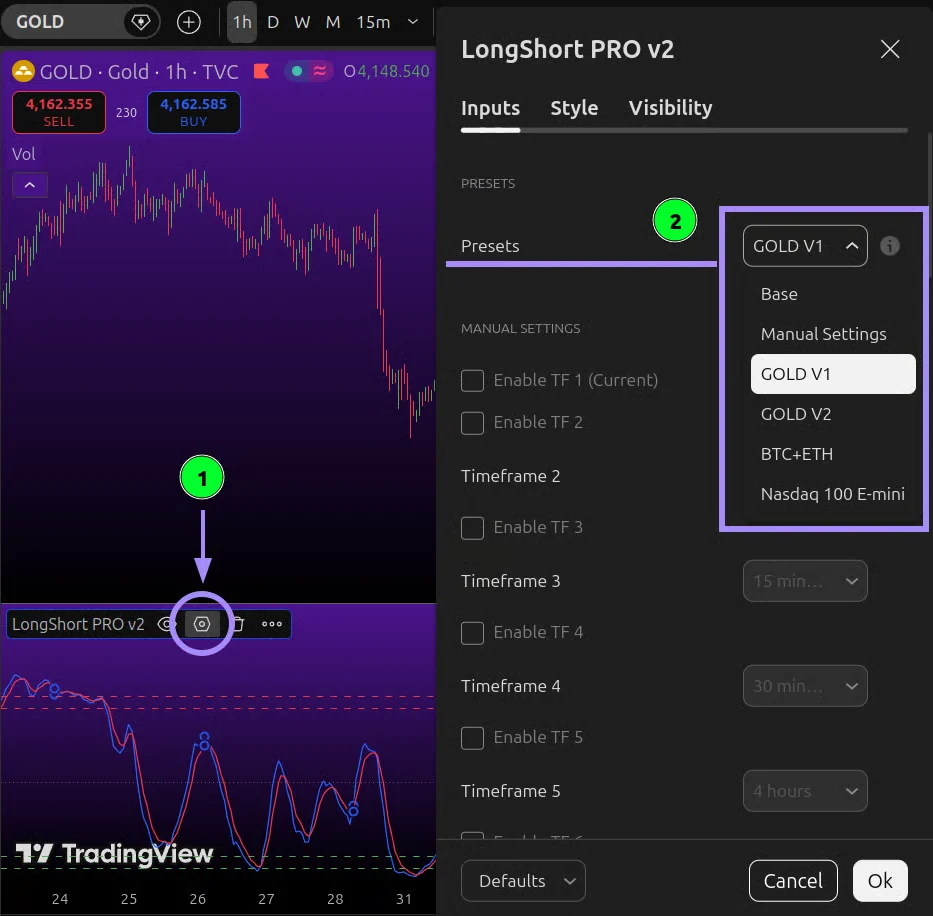
Keep Show LONG / SHORT labels, Show table, and Show guidance enabled.

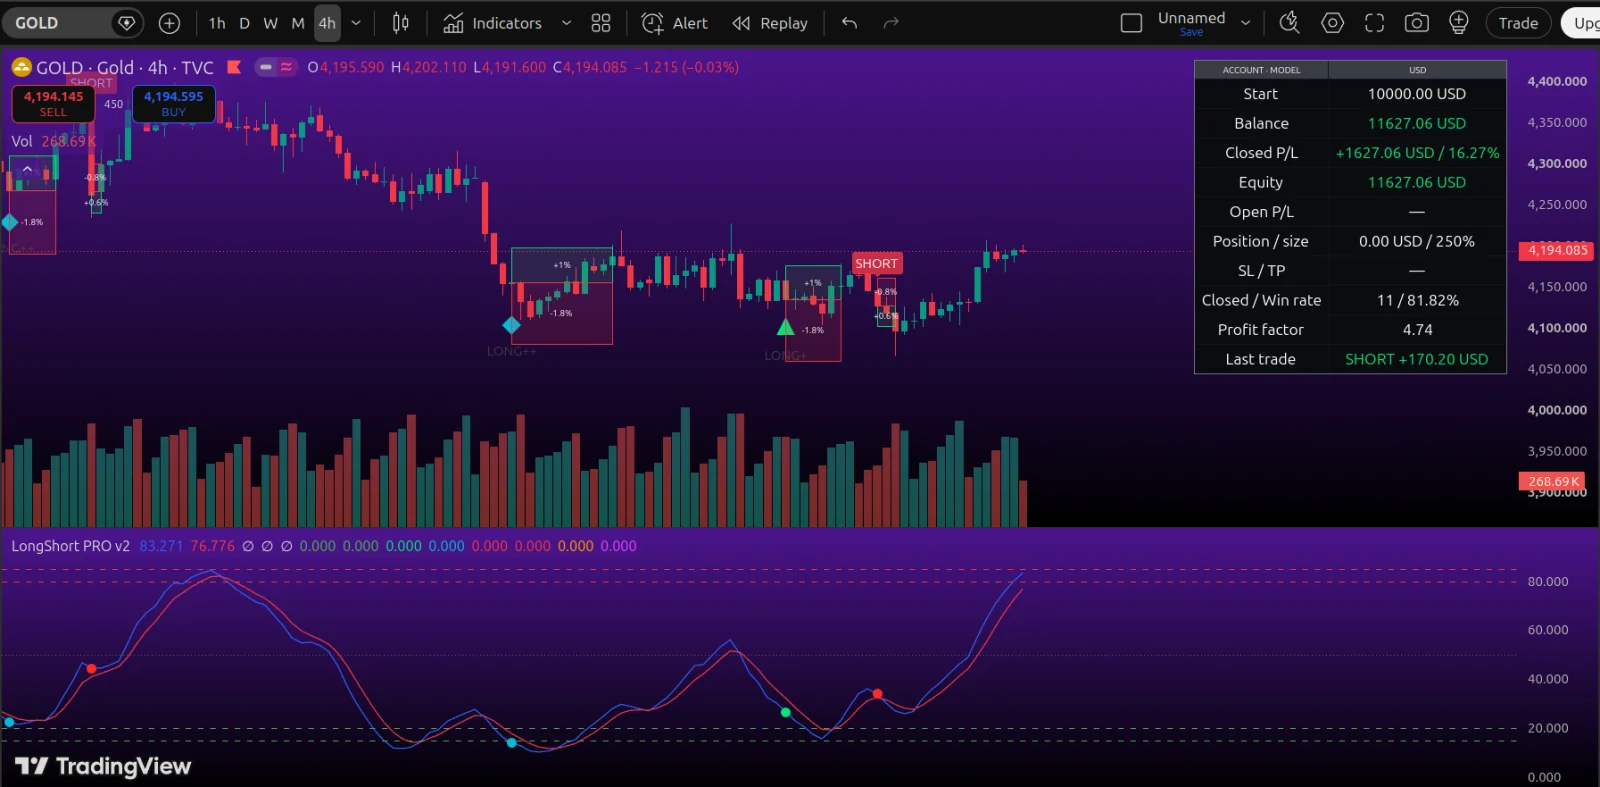
Review the indicator's signals on historical data and wait for the current candle to close: the label appears on close (if its conditions were met).
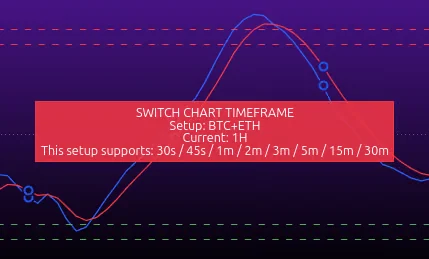
If a hint appears in the indicator pane, don't ignore it. Hints tell you when you're on the wrong timeframe or using the wrong indicator mode.
How to read the chart#
In the indicator pane you see the K and D lines and signal dots, and on the price chart – labels and trade zones. Read entry, stop, and target on the price chart, not from the dot's position in the indicator pane.
Indicator pane#
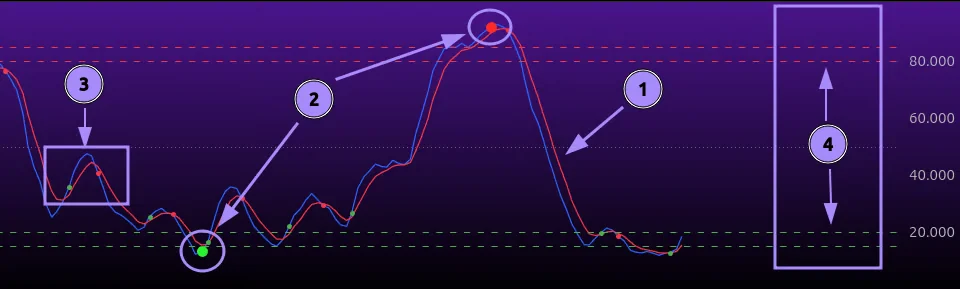
| Element | What it means |
|---|---|
| 1. K Current TF and D Current TF | Blue and red lines of the current chart's stochastic. A low or high value on its own doesn't indicate a reversal |
| 2. Large colored dot | A confirmed indicator signal |
| 3. Small K/D dots | Line crossings only. They are enabled separately and are not a signal |
| 4. Lines 15, 20, 80, 85, and 50 | Fixed reference levels, 50 is the midpoint of the range. They don't move when manual thresholds change |
Labels on the price chart#
| Label | LONG | SHORT | What it means |
|---|---|---|---|
| LONG / SHORT | 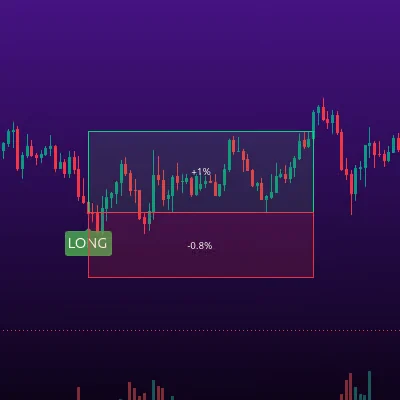 | 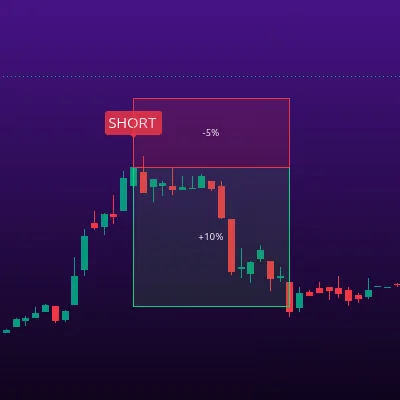 | Standard confirmed signal |
| LONG+ / SHORT+ | 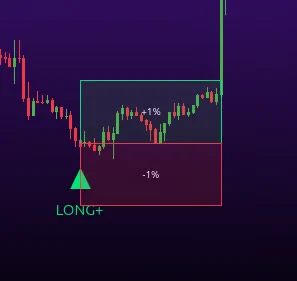 | 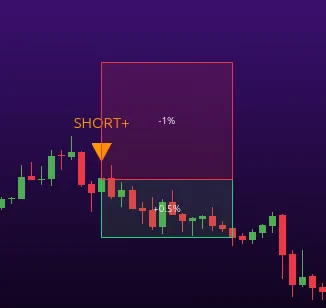 | A signal with additional quality markers, shown as a triangle |
| LONG++ / SHORT++ | 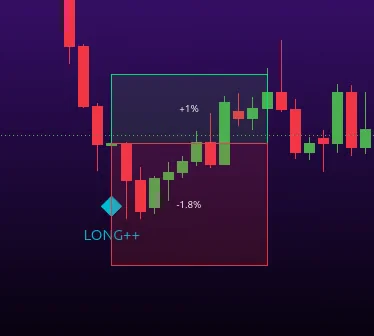 | 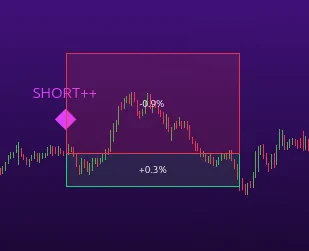 | A higher internal class, shown as a diamond |
The class is assigned when a signal appears. Plus-rated signals may occur less often. Where they are available:
| GOLD V1 timeframe | LONG+ and LONG++ | SHORT+ and SHORT++ |
|---|---|---|
| 30s, 1m, 2m, 3m, 5m, 15m, 30m, 45m | Yes | Yes |
| 1h, 3h, 4h | Yes | No |
| 2h | No | No |
Only the highest class is shown per trade: LONG++ is one signal, not three. Pluses don't create a separate trade, don't change its SL or TP, and don't guarantee profit.
Plus-rated signals only exist where they are provided by the profile and direction. Base, Manual Settings, BTC+ETH, and Nasdaq 100 E-mini modes don't have these classes.
Entry, SL, and TP zones#
If the mode tracks trades, a green zone up to the target and a red zone down to the stop appear on the chart. For LONG, the target is above the entry and the stop is below; for SHORT, it's the reverse.
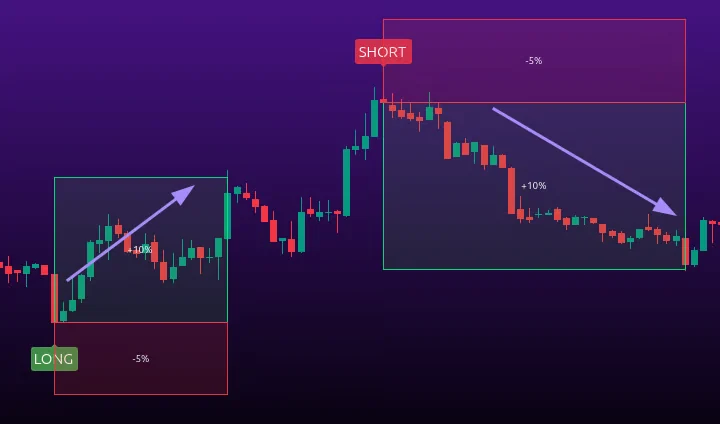
To see the zones on the chart, also enable Show Entry / SL / TP. This checkbox only controls the visual display on the chart and does not disable position tracking.
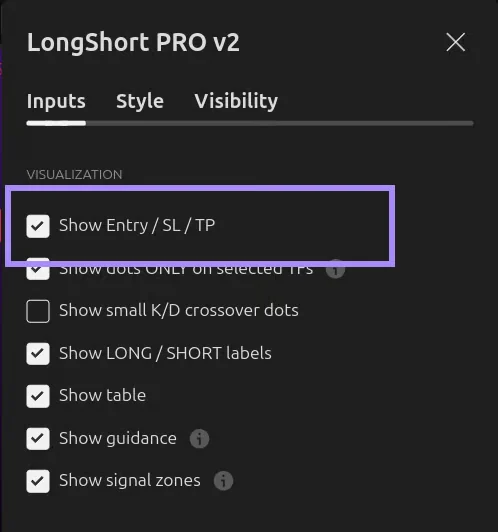
On timeframes above 4h, GOLD mode switches to Base mode: signals and the timeframe table remain, but SL and TP levels are not calculated.
How to read the account table#
The ACCOUNT TABLE – MODEL shows a simulated account in USD based on trades from the loaded chart history, not your broker or exchange balance. It only appears in modes with defined SL and TP.
In Base mode, the account table is replaced by a table showing the state of each tracked timeframe: LONG, SHORT, or WAIT.
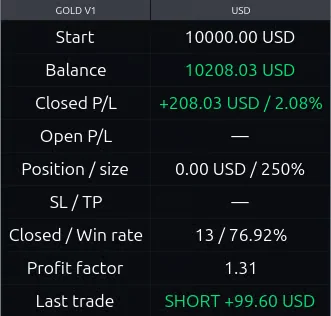
| Field | What it means |
|---|---|
| Start | The initial amount from which the selected range is recalculated |
| Balance | Initial amount + the result of closed trades in the range |
| Closed P/L | Profit or loss of closed trades in USD and as a percentage of the initial amount |
| Open P/L | Current result of an open position. A dash means there is no position |
| Closed / Win rate | Number of closed trades in the range and the percentage of profitable trades |
| Profit factor | Total cash profit divided by the absolute value of total losses. A PF of 1.5 means 1.5 USD of profit per 1 USD of loss, not a 150% return and not a win percentage |
| Last trade | Direction and result of the last closed trade. This is a single trade, not a measure of the strategy |
Important: the table shows the best range, not the entire history. It automatically selects the most profitable range of recent closed trades within the defined limits. For example, out of the last 50, it may show the last 30. The range keeps all trades, including losing ones. So the win rate and return in the table refer to the selected range, not the strategy's entire history.
Rules worth knowing from day one#
- Only one model position is tracked at a time. New signals during an open trade are not allowed and are not queued.
- After a trade closes, a new one does not open on the same candle.
- In most GOLD profiles, the label appears on candle close, and the model entry is on the next available open. So the label and the start of the zone may sit on adjacent candles.
- Some profiles can close a trade by a time limit, so not every close happens exactly at SL or TP.
- Active trade zones extend 15 candles forward. This is the drawing length, not the holding period.
- The chart keeps the zones of the last 20+ trades (the number depends on your TradingView plan; the higher the plan, the more it shows).
The absence of old zones does not mean old signals are missing – on a longer history, signals are still shown, but without SL / TP zones.
Which timeframe to choose#
Choose a timeframe based on how much time you can give to the chart, not on the number of trades in the test. On lower periods you need to react faster – there are more signals and trades. On higher timeframes there are fewer signals, and each decision needs less attention.
Don't choose 30s just because the test shows more trades on it.
Each timeframe in GOLD uses its own logic: not only the scale changes, but also the trade parameters. On charts above 4h, GOLD mode switches to Base mode: signals and the timeframe table remain, but SL and TP levels are not calculated.
The free TradingView subscription does not support these timeframes: 30s, 2m, 10m, and 6h. These are TradingView limitations, not indicator limitations. If you want to work with these timeframes, consider upgrading your TradingView subscription.
Alerts#
Once you have set up your strategy, you can enable alerts for signals appearing on the chart with your settings.
Set up the chart according to the instructions or your personal strategy.
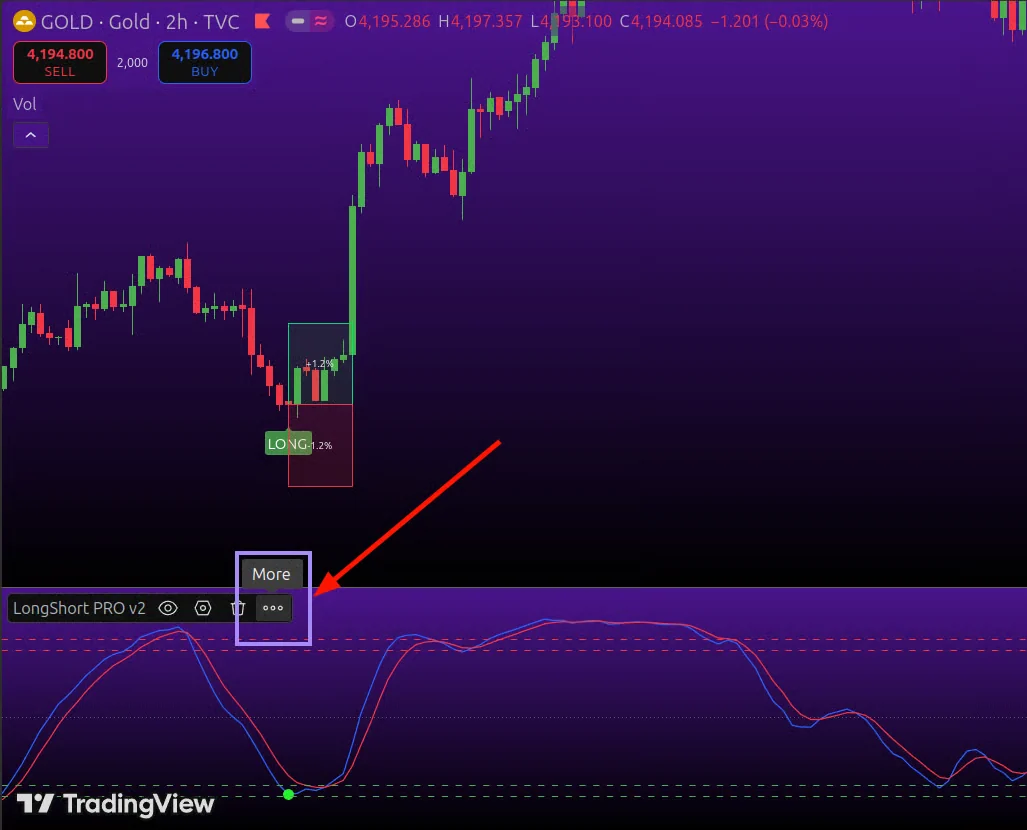
Next to the indicator name, click the three dots.
Select "Add alert on LongShort PRO...".
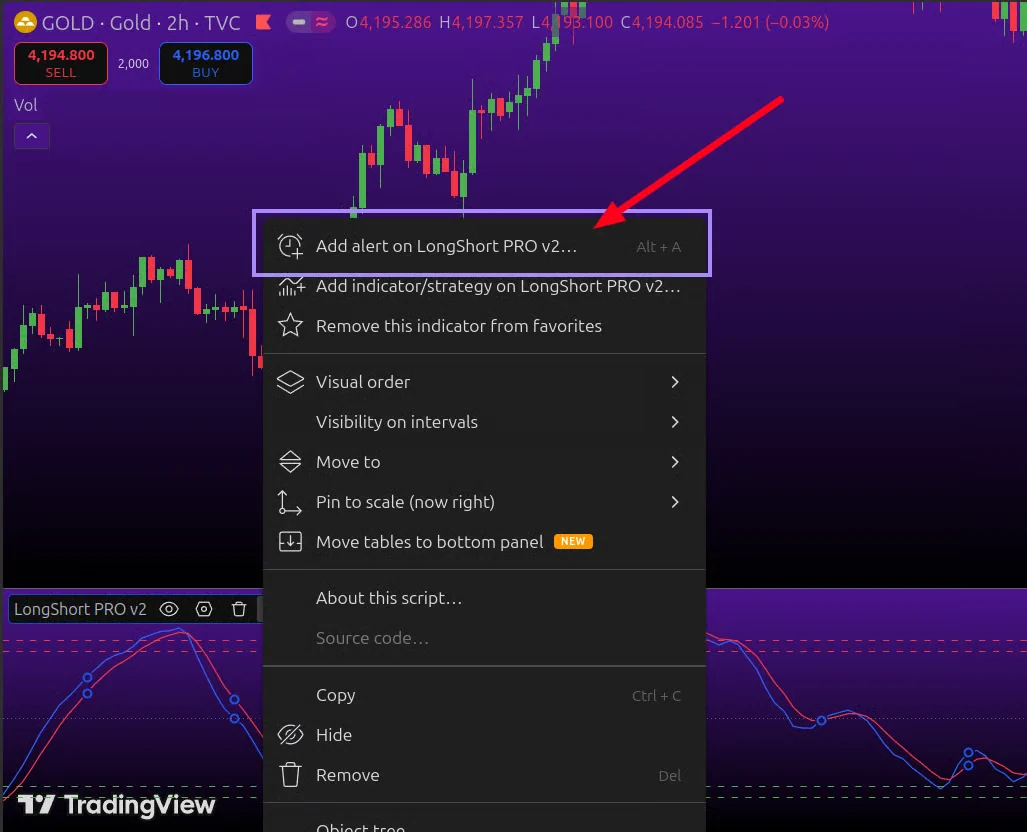
Next, select which signal you want to get notifications for – LONG or SHORT. Don't change the interval: leave it the same as the chart.
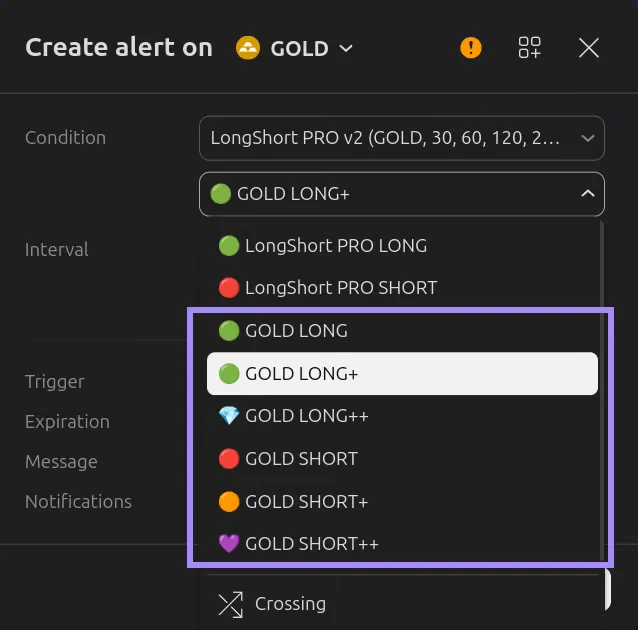
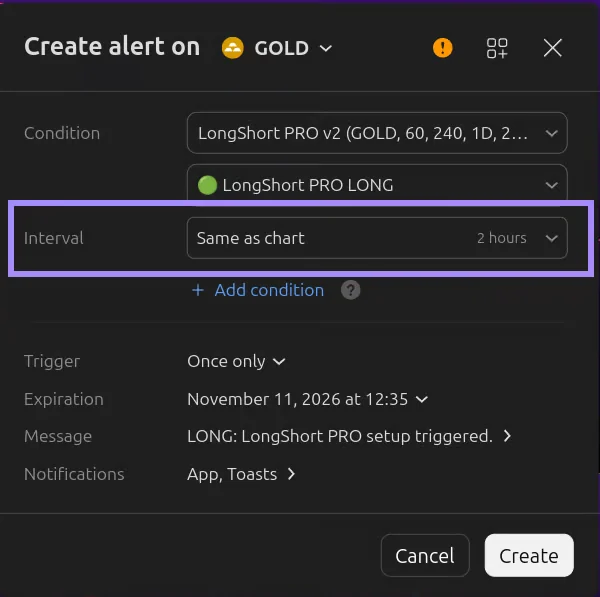
Each GOLD class is a separate event. A GOLD LONG alert does not include LONG+ or LONG++. To get notifications for all classes of a direction, create an alert for each one. An event appearing in the list does not mean the class is available on every timeframe.
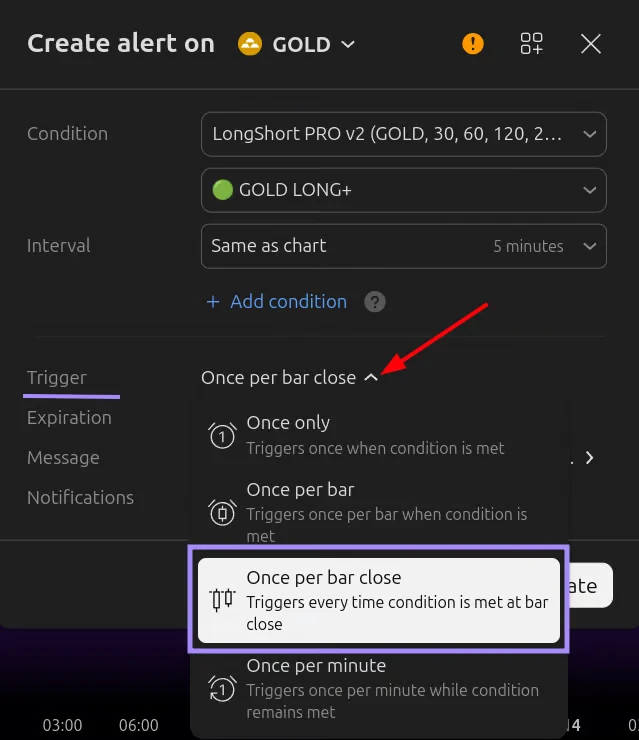
Change the "Trigger" field to "Once per bar close". Then click "Create".
You can track active alerts on the Alerts tab in the top right corner of TradingView.
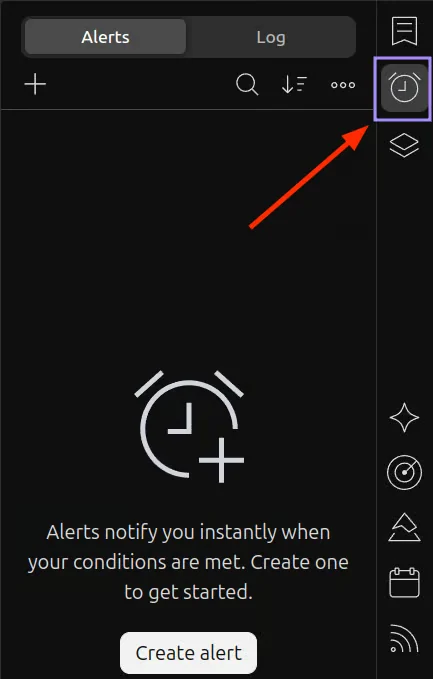
After changing settings, timeframe, or indicator version, recreate the alert: TradingView uses the parameters saved when it was created. Hiding drawings on the chart does not disable existing alerts.
Official TradingView help on alerts:
https://www.tradingview.com/support/solutions/43000595315-how-to-set-up-alerts/
In the free TradingView subscription, you can create an alert only once. This is a TradingView limitation, not an indicator limitation. If alerts are important to you, consider upgrading your TradingView subscription.