Settings overview
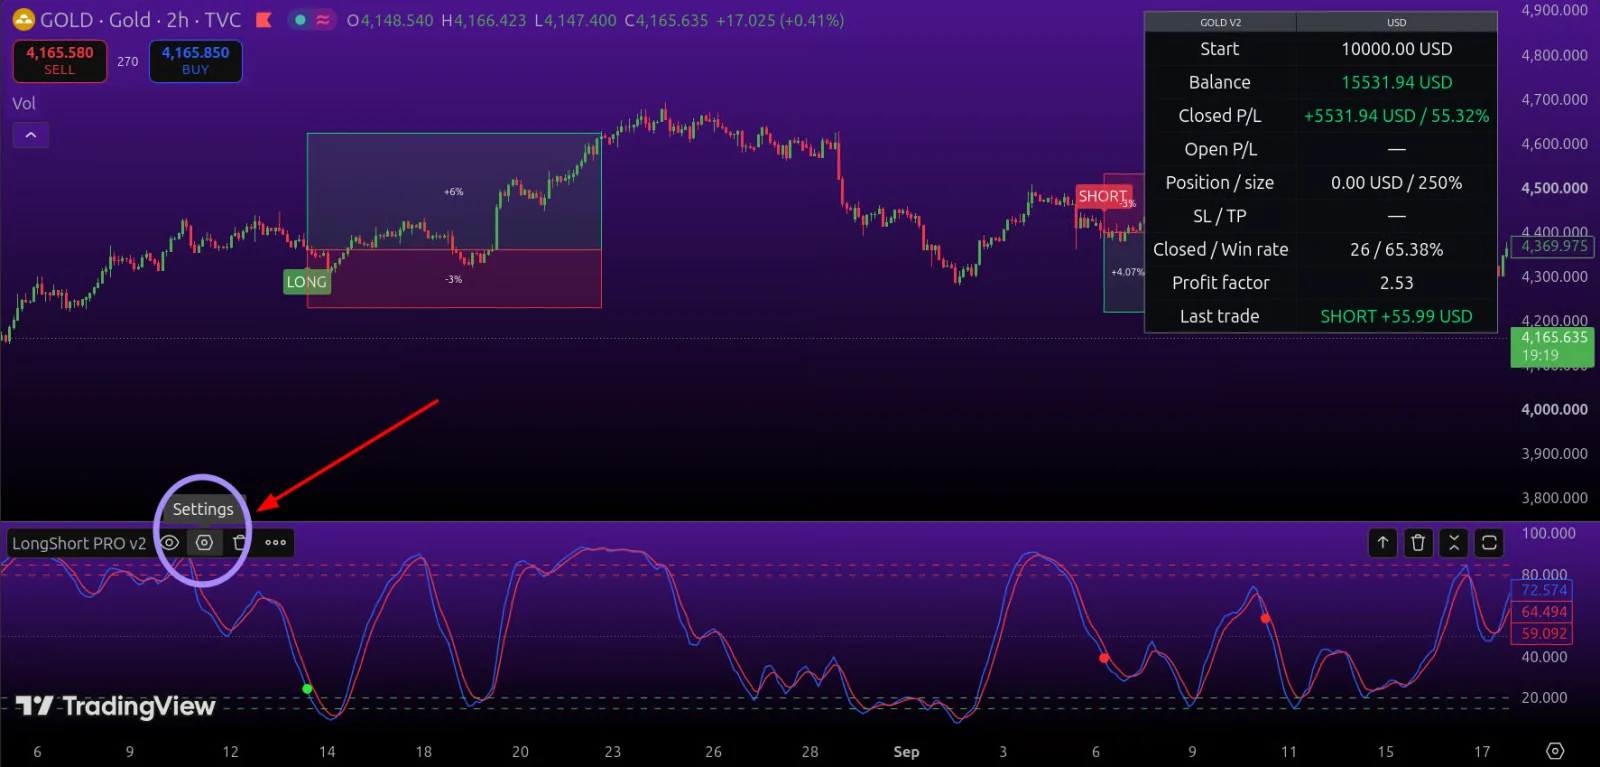
When you add the indicator, it will appear in the lower zone below the price chart. The indicator's name will be in the upper left corner.
To open the settings, click the gear icon next to the indicator's name.
Inputs settings menu#
The first page of the indicator settings, "Inputs", appears.
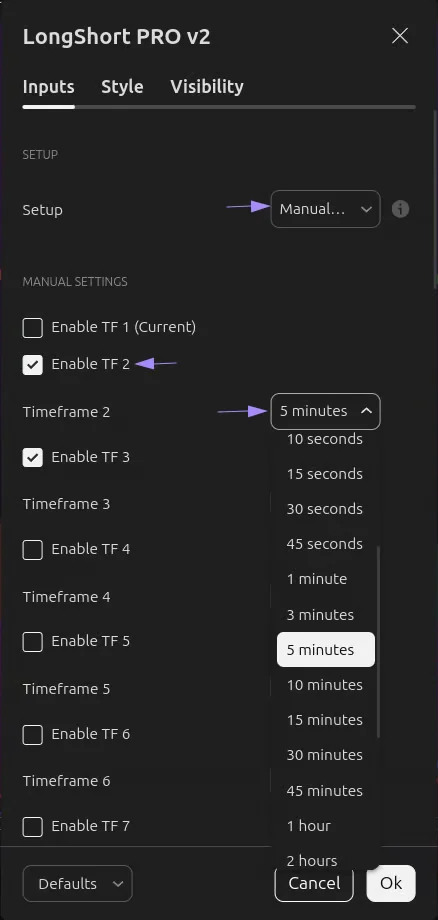
"Setup" – in this section you can select the indicator mode from the dropdown menu: one of the ready-made strategies (GOLD V1 / GOLD V2 / BTC+ETH / Nasdaq), Base mode, or Manual Settings.
In "Manual Settings" mode, you can set up which timeframes the indicator will consider when searching for a signal.
You can select up to 7 timeframes for analysis at the same time. When you check each Enable TF box, the indicator starts analyzing the selected timeframe and gives signals on the chart if a long or short signal appears on all checked timeframes (the indicator is in the overbought or oversold zone).
To select a timeframe for tracking, first check the box, then choose the timeframe from the dropdown.
Without the checkbox, timeframes will not be tracked.
Important: if "Enable TF 1 (Current)" is checked, you do not need to specify the timeframe your chart is open on separately.
Example: your chart is open on 4h.
"Enable TF 1 (Current)" is checked.
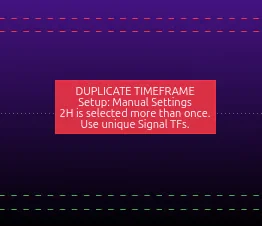
If you check "Enable TF 2" and select 4h, the indicator will not show signals because the tracked timeframe is duplicated, and it will display an error message.
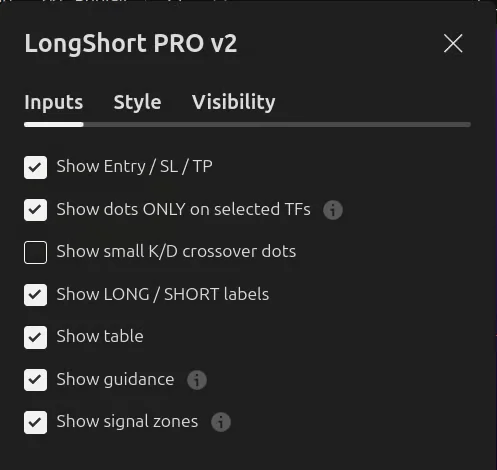
"Show Entry / SL / TP"
Shows entry, Stop Loss, and Take Profit zones on the price chart.
Works when the selected mode tracks trades.
In Base mode there are no zones; in Manual Settings mode it shows zones only if SL/TP settings are defined.
"Show dots ONLY on selected TFs"
If enabled: signals are visible only when the chart is open on one of the timeframes selected for tracking.
If disabled: signal dots are always visible when conditions align.
Helps avoid false signals when viewing the chart on timeframes other than those selected for analysis.
"Show small K/D crossover dots"
This option turns the small dots at line crossings in the indicator on or off. It is disabled by default to avoid noise on the chart.
"Show table"
Enables the table: without SL/TP settings it shows the state of the timeframes, with SL/TP settings it shows the ACCOUNT TABLE – MODEL.
"Show guidance"
Shows current hints (an error or status message).
If disabled, the error text will not appear, but signal blocking remains. Beginners should leave it enabled.
"Show signal zones"
Shows four dashed lines at levels 15, 20, 80, and 85 in the indicator pane.
Style settings menu#
The second tab contains the indicator's color settings. Here you can change the indicator's visual appearance to your liking.
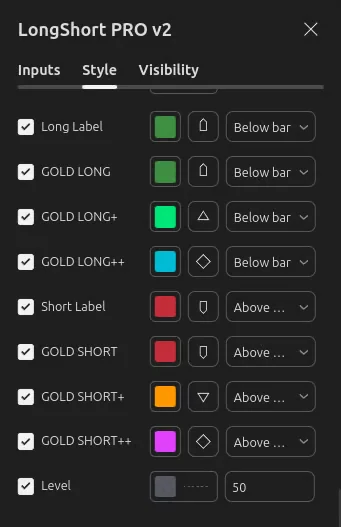
"Long Label" and "Short Label"
Lets you set the color, transparency, and shape of the signal on the price chart.
GOLD LONG / GOLD LONG+ / GOLD LONG++ / GOLD SHORT / GOLD SHORT+ / GOLD SHORT++
Configure the color, transparency, and shape of the signal on the price chart in GOLD V1 and GOLD V2 modes.
"Level"
Configures the appearance, color, and position of the middle horizontal line in the indicator pane.
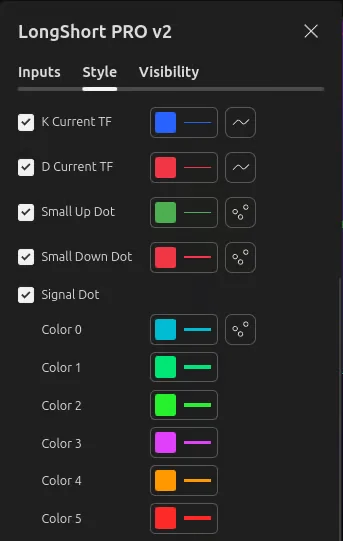
"K Current TF" / "D Current TF"
K and D of the current timeframe control the color of the lines in the indicator.
"Small Up Dot" / "Small Down Dot"
Control the color of the dot at line crossings. The dots are enabled in the "Inputs" menu.
"Signal Dot"
Controls the color of the large dots that notify you of matching signals on the selected timeframes.
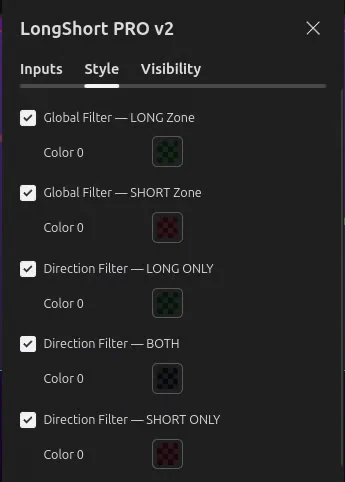
"Global Filter - LONG Zone" / "Global Filter - SHORT Zone"
The background of the zone where the Global Filter allows new LONG or SHORT signals.
Green and red by default.
"Direction Filter - LONG ONLY" / "Direction Filter - BOTH" / "Direction Filter - SHORT ONLY"
The background of the zone where the Direction Filter allows signals: LONG only / BOTH / SHORT only.
Green / transparent / red by default, respectively.
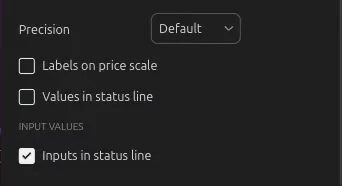
"Precision"
Number of decimal places to show for the indicator's values. Default means the standard format.
"Labels on price scale"
Shows labels of the indicator's latest values on the price scale on the right. If unchecked, the labels disappear.
"Values in status line"
Shows the indicator's numeric values in the line next to its name in the top left corner when you hover over candles.
"Inputs in status line"
Shows the values of the indicator's input settings in the same line, next to its name.
Visibility settings menu#
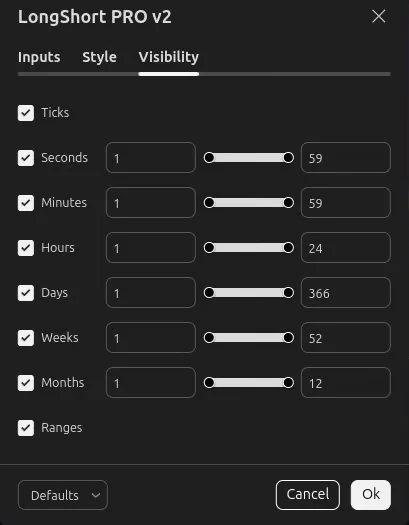
In this menu, you can disable the visibility of the indicator on certain TFs. For the basic setup, no changes need to be made in this menu.
Save your settings as default#
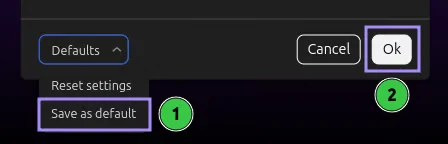
After completing the full setup, it is recommended to save the current settings. To do this, click the "Defaults" menu, select "Save as default", and click "OK". This way, even if the indicator is deleted and reopened, the current settings will load as the defaults.