Getting started
Follow this guide to choose a plan, complete checkout, connect your TradingView account, and add the LongShort PRO indicator to your chart.
From choosing a plan to adding LongShort PRO to your TradingView chart#
Step 1 – go to the LongShort PRO website#
Go to longshortpro.io and click the "Get the Indicator" button.
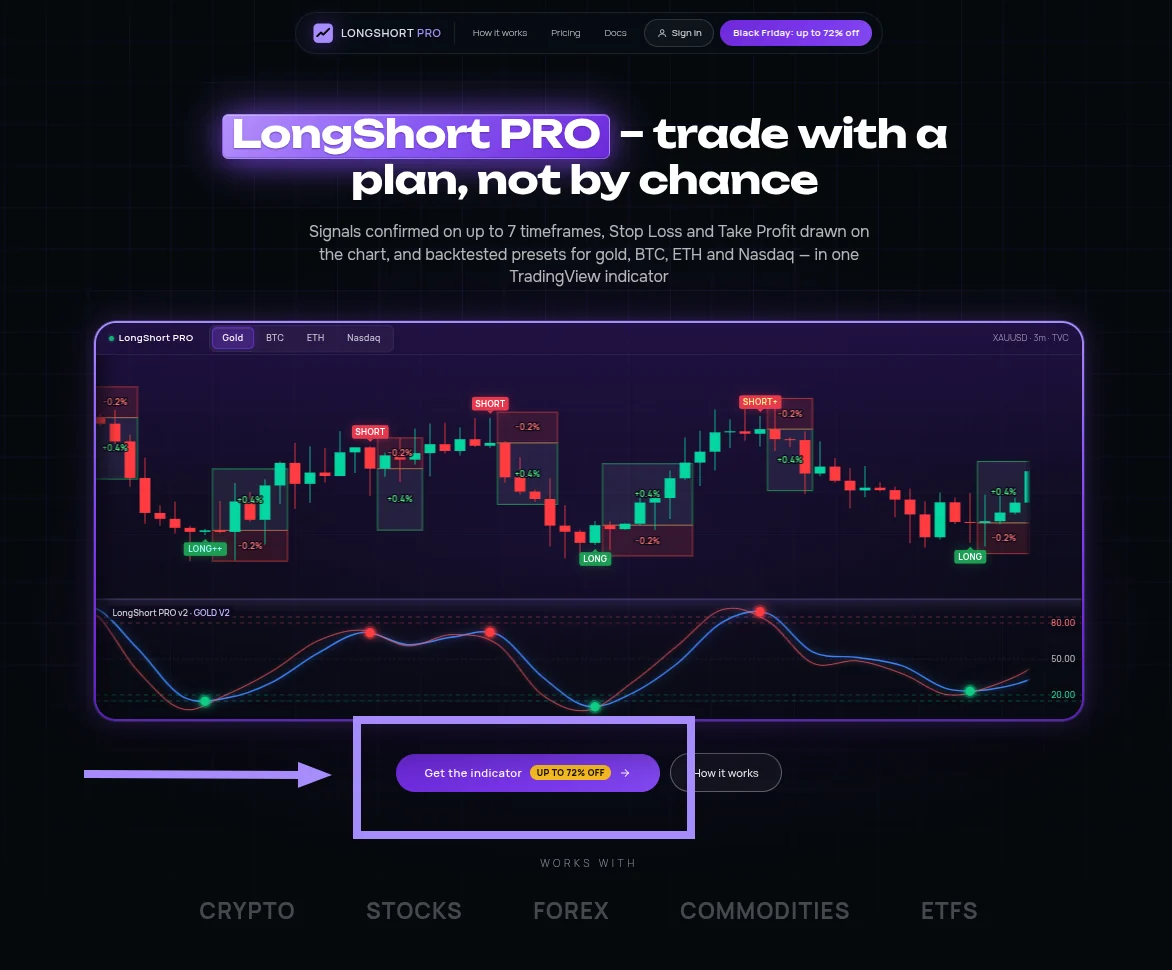
You'll be taken to the pricing section.
Choose the plan that best suits you: click "Subscribe Monthly" or "Get Lifetime Access". A checkout window will open.
Step 2 – enter your email and apply a promo code if you have one#
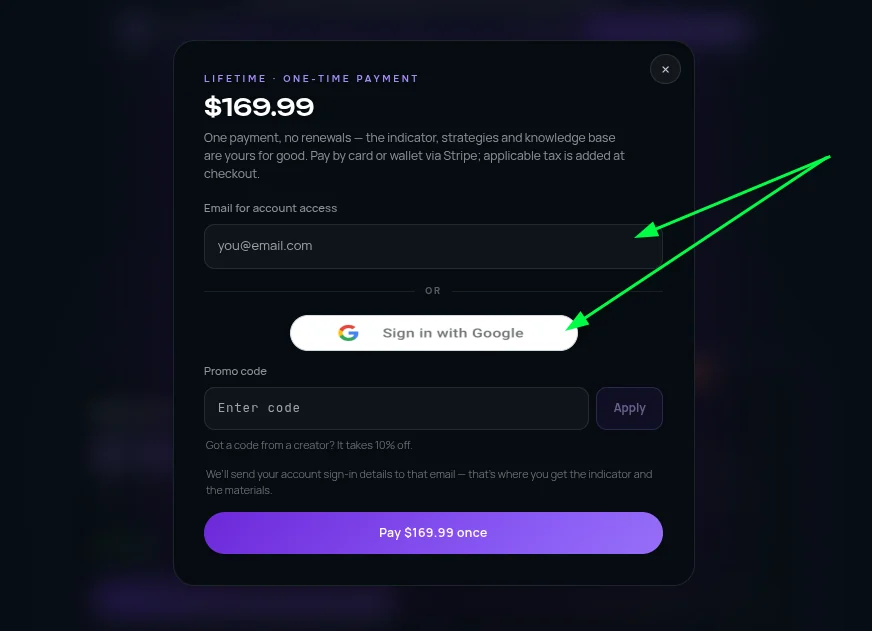
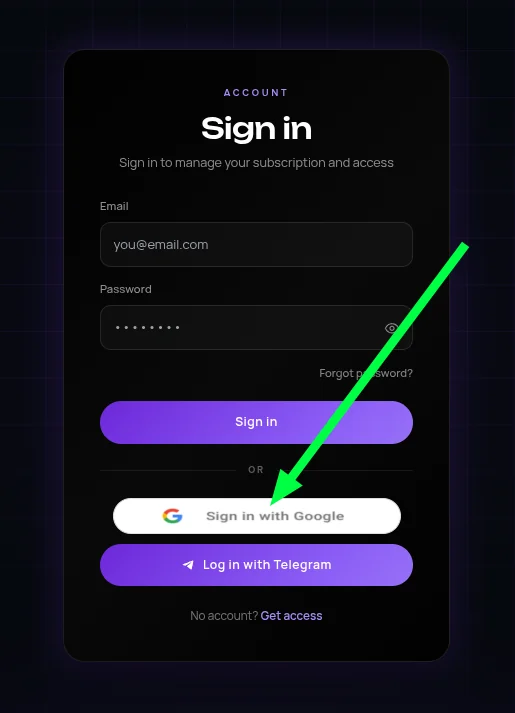
Enter the email address you want to use for your LongShort PRO account, or sign in with your Google account.
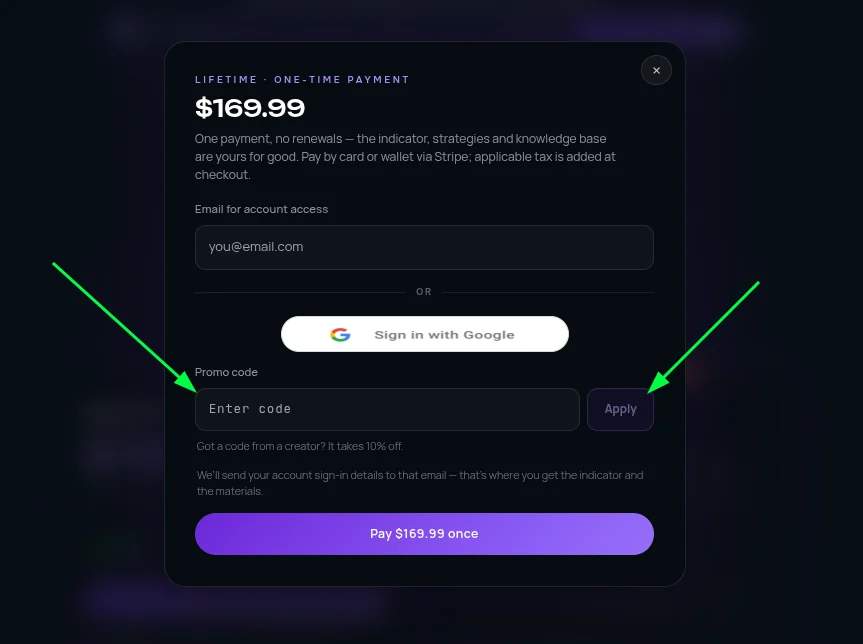
If you have a promo code, enter it in the promo-code field and click "Apply".
Make sure the discount has been applied before continuing.
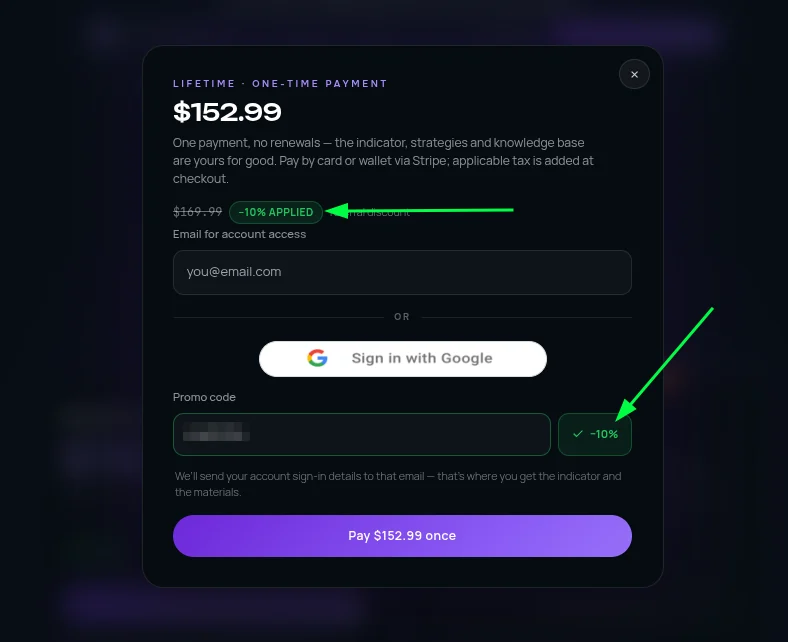
After entering your email address or signing in with Google and applying any promo code, click "Subscribe with Stripe" or "Pay ... once".
Step 3 – complete your payment#
You'll be redirected to Stripe's secure checkout page, where you can complete your payment using one of the available payment methods.
Step 4 – log in to your LongShort PRO account#
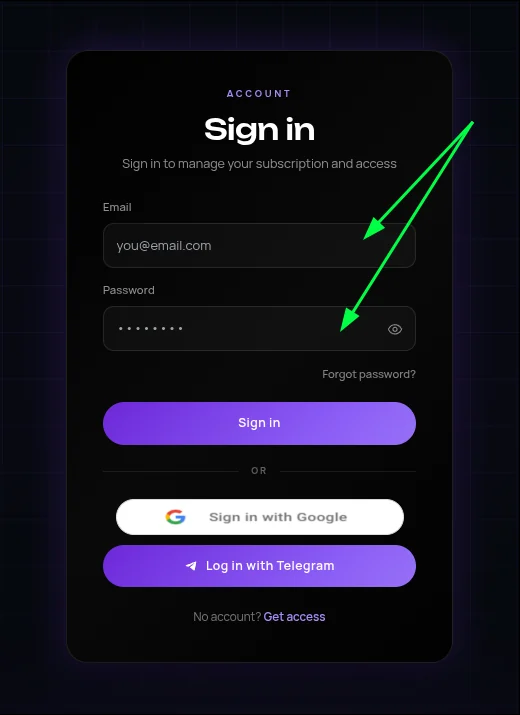
Go to longshortpro.io/login.
If you used Google to sign in during checkout, log in with the same Google account.
If you entered your email address during checkout, find the email you received after your purchase. Open the link in the email to create a password for your account.
Once you've created your password, return to the login page and sign in using your email address and password. If you can't find the email, check your Spam folder.
Step 5 – connect your TradingView account#
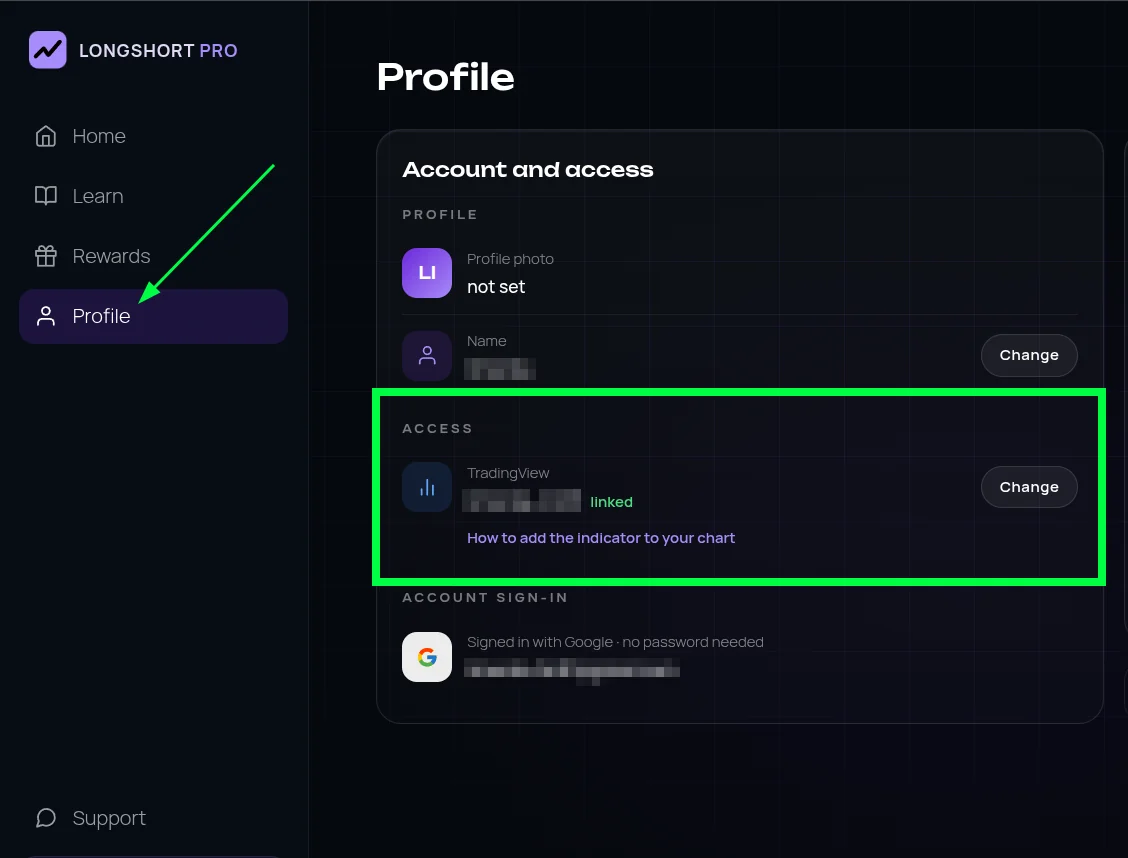
The first time you log in to your LongShort PRO account, the onboarding process will ask you to enter your TradingView username. Enter your username to link your TradingView account.
If you skipped this step:
Open the "Profile" tab. In the "Access" section, enter your TradingView username.
The system will automatically grant you access to the indicator.
Step 6 – add the indicator to your TradingView chart#
Open TradingView and go to a chart. Select "Indicators", then open "Invite-only".
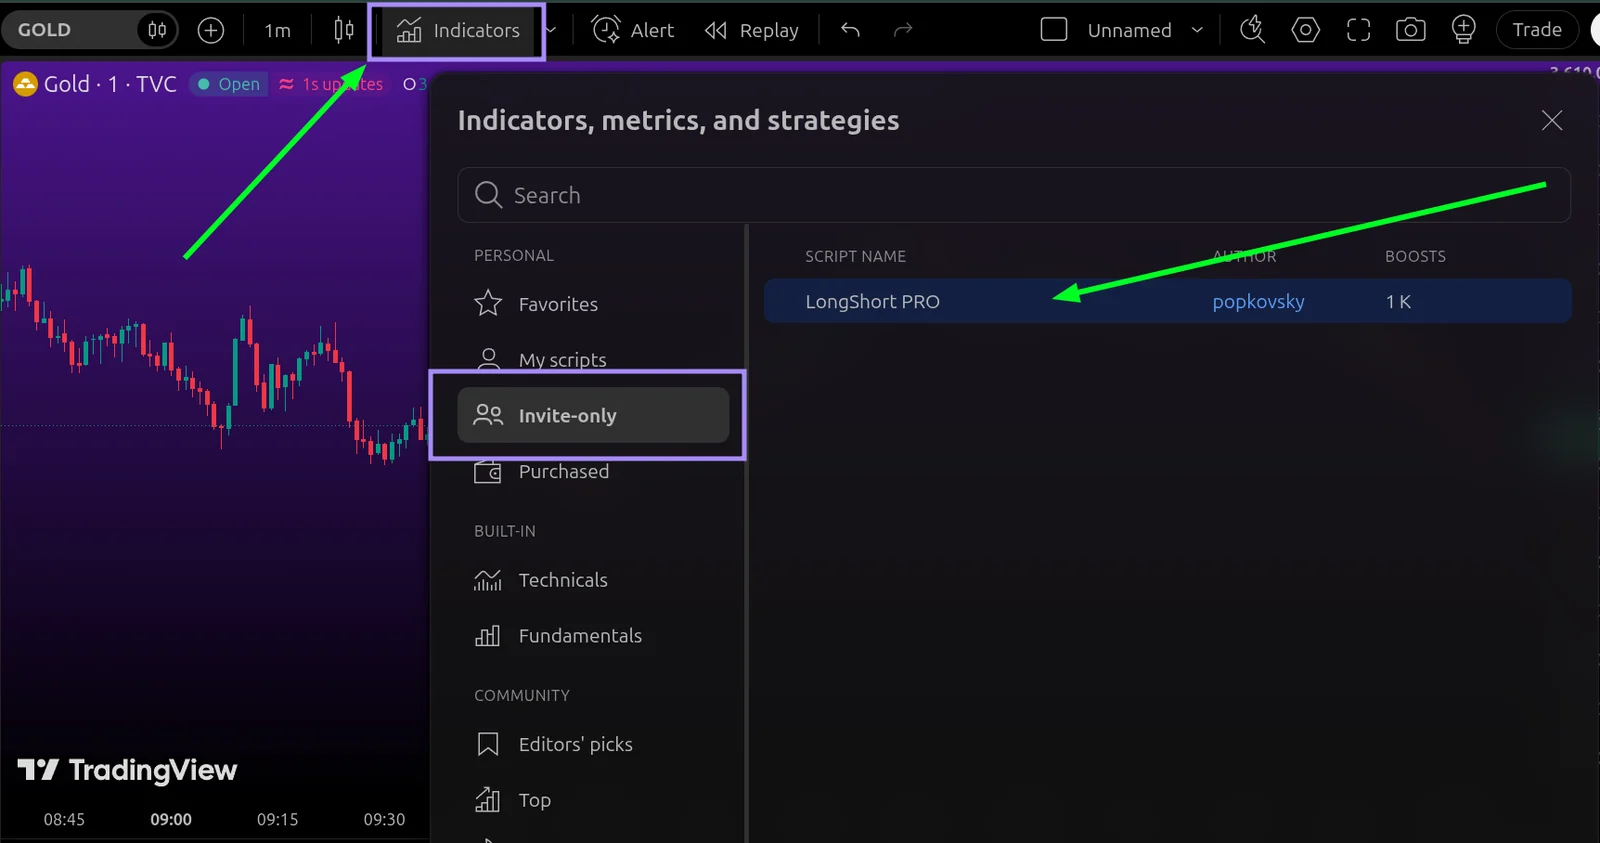
Find "LongShort PRO" in the list and click it to add the indicator to your chart.
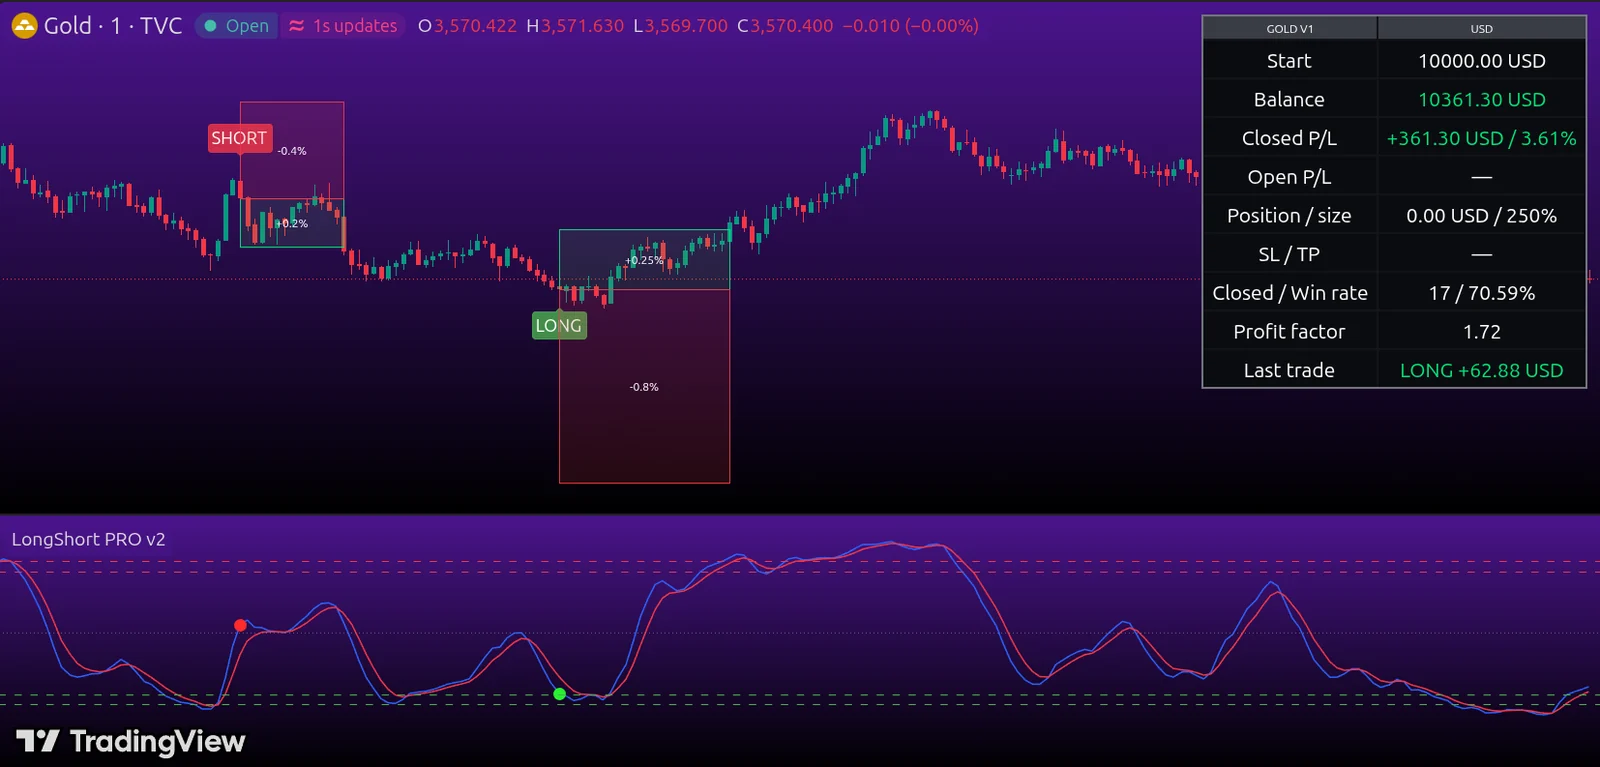
"Invite-only" isn't visible, or LongShort PRO is missing or unavailable
- If you can't find "Invite-only" or LongShort PRO is missing/unavailable – log out of your TradingView account, log back in, and check again. This should help refresh your access.
- If you're using TradingView in a web browser, clearing the browser's cache and cookies may help refresh your access. This may sign you out, so make sure you can log back in before clearing them.
- If you're using the TradingView desktop or mobile app, fully close the app and open it again. Then check "Invite-only" once more.
FAQ & troubleshooting#
Which timeframe should I choose?#
A timeframe is the period of time represented by one candlestick on a chart. For example, on a 1-minute chart, each candle represents one minute of price movement. On a 4-hour chart, each candle represents four hours.
The right timeframe depends on your trading style and how often you want to monitor the chart. Shorter timeframes tend to produce signals more frequently because price moves through the conditions required for a signal more quickly. However, each candle covers a shorter period, so small price fluctuations, or market noise, are more noticeable. As a result, trades may hit their Stop-loss more often.
Signals appear less frequently on higher timeframes. Each candle contains more price data, so brief fluctuations have less influence on the overall picture. Signals can be more reliable, but they may take longer to confirm. This does not guarantee profits or mean that a Stop-loss will not be hit.
If you prefer scalping and are comfortable monitoring the chart frequently, you could consider timeframes from 30 seconds to 10 minutes. Signals may appear more often, but market noise is also more noticeable.
For intraday trading, traders often use timeframes from 15 minutes to 1 hour. This is a middle ground. Signals are generally less frequent than on the shortest timeframes, and price movements are easier to assess in the context of the trading day.
For medium-term trading, you could consider timeframes from 1 hour to 1 day. Signals appear less frequently, and small fluctuations generally have less impact on the overall picture. These timeframes may suit traders who do not want to monitor the chart constantly and follow a medium-term approach.
Choose a timeframe based on your trading pace, not just on how often signals appear. The timeframes available in LongShort PRO depend on the mode you select, so check that your chosen mode supports the timeframe you want to use.
If you select multiple timeframes, for example in "BASE" mode or "Manual Settings", the indicator will look for the conditions to align across all of them. A signal is confirmed only if the conditions are met on every tracked timeframe when the candle on the highest timeframe closes.
Which indicator mode should I choose?#
Start by looking at the market shown on your chart. LongShort PRO modes are configured differently. Some are designed for specific markets and timeframes. If you select a mode that does not match your chart, the indicator may show a guidance message saying that your settings are unsupported, or it may not display signals.
- For gold charts, choose "GOLD V1" or "GOLD V2". These are two separate modes with different rules, and neither is universally best. Use a regular candlestick chart and a timeframe supported by the selected mode, from 30 seconds to 4 hours. On timeframes above 4 hours, GOLD switches to BASE behavior and does not calculate simulated SL/TP levels.
- The "BTC+ETH" mode is designed for BTC and ETH charts. It supports specific timeframes between 30 seconds and 30 minutes. Choose the relevant chart and check that its timeframe is supported by the mode.
- The "Nasdaq 100 E-mini" mode is designed for the MNQ chart, using regular candlesticks on a 30-minute timeframe. It generates LONG signals only. Signals are not available on other timeframes.
- Choose "BASE" if you want basic signals and a set of analysis timeframes that is selected automatically based on your chart's timeframe. BASE displays timeframe statuses and signals, but it does not simulate trades or calculate SL/TP levels.
- Choose "Manual Settings" mode if you want to set your own timeframes, signal direction, filters, and simulated trade tracking parameters. You can enable up to seven timeframes in this mode. It gives you more control, but requires more setup. If you are new to the indicator, consider starting with a suitable preset.
What is the difference between GOLD V1 and GOLD V2?#
Both strategies showed positive results over the test period. "GOLD V1" performed slightly better in the backtests, but in this preset the distance from the entry price to the Stop-loss is always 2 to 3 times the distance from the entry price to the Take-profit.
"GOLD V2" was developed as an alternative with a different risk-to-reward ratio. In this mode, the Take-profit is always set at the same distance from the entry price as the Stop-loss, or farther away. "GOLD V2" performed slightly less well than "GOLD V1" in the backtests, but it also remained profitable over the test period.
If backtest performance is your priority and you are comfortable with a wider Stop-loss, choose "GOLD V1". If you want the Take-profit to be at least as far from the entry price as the Stop-loss, choose "GOLD V2".
Why aren't there any signals on my chart?#
The absence of a signal doesn't necessarily mean that the indicator isn't working. A signal appears only when the conditions for the selected mode are met across all the timeframes being monitored. If the required conditions aren't met on even one of them, a confirmed signal label won't appear yet.
Check that the selected mode matches your chart and timeframe. Use standard candlesticks, and make sure the selected preset supports the current timeframe. If your settings aren't supported, the indicator may show a guidance message explaining why.
If you're using Manual Settings, make sure at least one timeframe is enabled, the chart's current timeframe is included in the analysis, and no timeframe is selected more than once. Also check that a filter isn't blocking new signals.
A signal is confirmed only after the candle closes on the highest timeframe being monitored. Until then, the values and statuses in the table may change. If you see a dot in the indicator pane but no signal label on the price chart, wait for the candle to close.
If the indicator displays a guidance message, check what it says. It may tell you that no timeframe is selected, a timeframe is selected more than once, the selected mode doesn't support it, or it doesn't match the chart.
Even after you correct the settings, a signal will appear only when market conditions meet the rules of the selected mode.
Why does the indicator show one or more losing trades in a row?#
No indicator or tool can predict the direction of price movements with 100% accuracy. This is mathematically impossible.
That is why all of our strategies use calculated Stop-loss and Take-profit levels that allow the strategy to remain profitable over a large number of trades. A strategy is evaluated based on all trades, including both those that generate a profit and those that hit Stop-loss. An individual trade may result in a loss, and several losing trades may occur in a row. This is a normal part of how a strategy works.
The true potential of a strategy is revealed over the long term, based on a large number of trades.
In our backtests, the overall results remained positive, despite individual losing trades and consecutive stop-losses.
Important: Backtesting does not guarantee the same result in the future. The indicator evaluates technical conditions and shows when an asset is overbought or oversold (often potential reversal points), but it does not account for news, macroeconomic events, capital flows from ETFs, geopolitical tensions, and other unpredictable factors that can affect the price.
How do I set up alerts?#
You can find instructions on setting up alerts in TradingView in our "Setting up alerts" guide.
The indicator is showing an error. What should I do?#
You can find a list of indicator messages and instructions on how to resolve them in our "Indicator messages" guide.