Setting up SL/TP zones
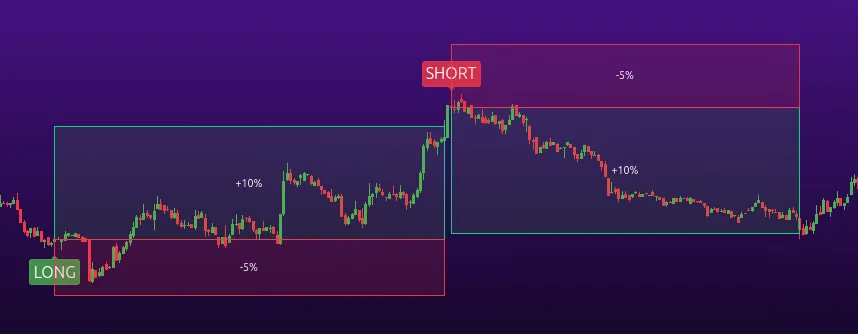
When the mode tracks trades, a green zone up to the target and a red zone down to the stop appear on the price chart. For LONG, the target is above the entry and the stop is below; for SHORT, it's the reverse.
Setting up SL/TP zones#
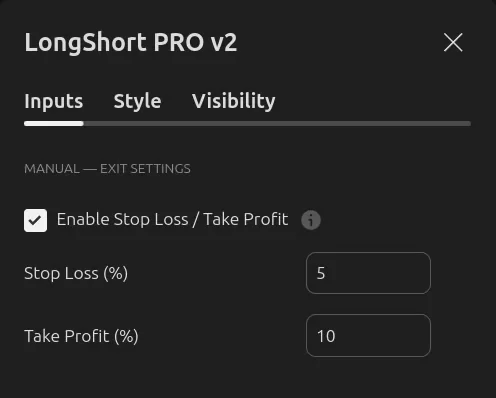
In Manual Settings mode, you can set the distance to the stop and target yourself as a percentage of price, and the model tracks trades until they close at one of the levels. These levels apply only in Manual Settings.
"Enable Stop Loss / Take Profit"
Enables trade tracking, SL and TP, and blocking of simultaneous positions.
If disabled, signals remain, but without model trade tracking and without the ACCOUNT TABLE – MODEL.
"Stop Loss (%)"
The distance from the model entry to the stop as a percentage of price.
"Take Profit (%)"
The distance from the model entry to the target as a percentage of price.
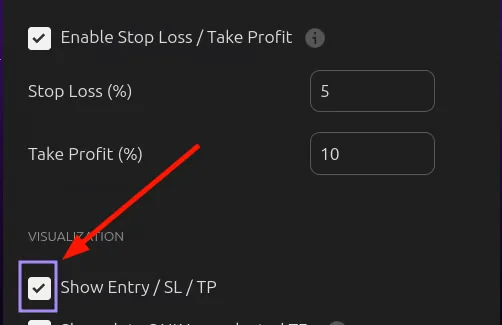
To see the zones on the chart, also enable Show Entry / SL / TP. This checkbox only controls the visual display on the chart and does not disable position tracking.
The chart keeps the zones of the last 20+ trades (the number depends on your TradingView subscription: the higher the plan, the more zones it shows).
The absence of old zones does not mean old signals are missing – on a longer history, signals are still shown, but without SL/TP zones.
How the model calculates a trade#
The entry is modeled at the close of the signal candle, rounded to the price step. SL and TP checks begin from the next candle. If both levels fall within the range of one candle, the model counts SL first. This is a calculation rule, not a confirmation of the order of real trades within a candle.
Only one model position is tracked at a time. New entries during an open trade are not allowed and are not queued. After a trade closes, a new one does not open on the same candle.
In most GOLD profiles, the signal label appears on candle close, and the model entry is on the next available open. So the label and the start of the zone may sit on adjacent candles. In Manual mode, the model entry is taken at the close of the signal candle.
Some ready-made profiles can close a trade by a time limit, so not every model close has to happen exactly at SL or TP. In Manual Settings, there is no separate time exit.
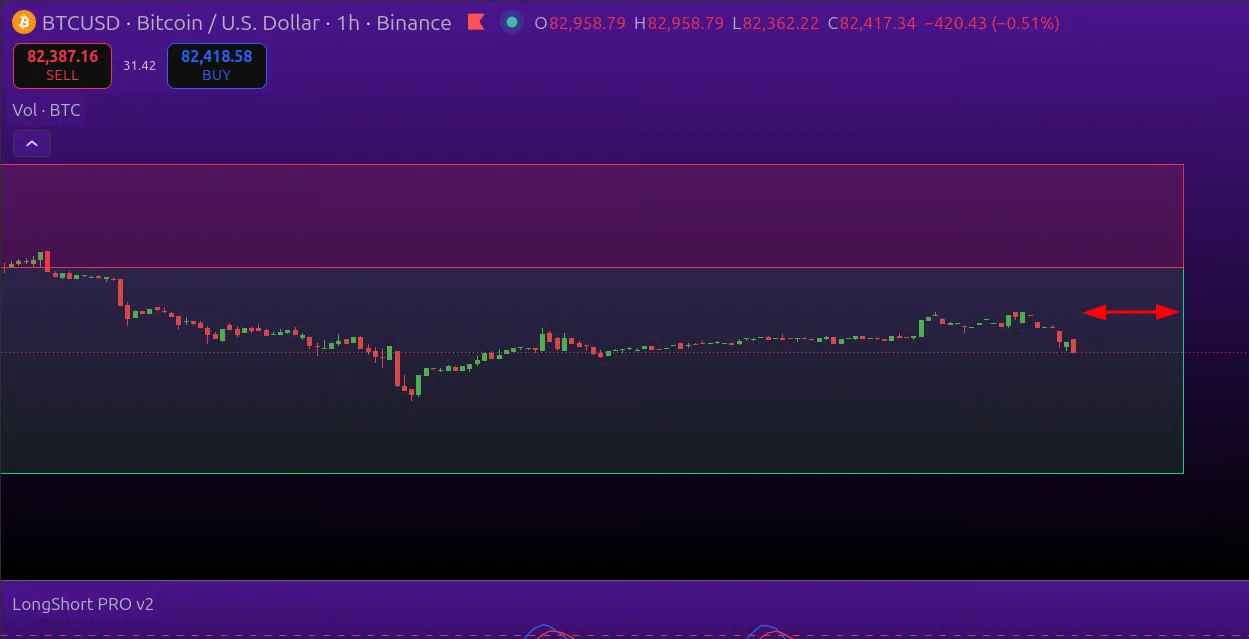
Active zones extend 15 candles forward. This is the drawing length, not the holding period of the trade.
If the entry, stop, or target price comes out incorrect (for example, non-positive or incorrectly positioned), the model skips that trade. Check the SL and TP distances and the instrument's price step.